Applied Physics: Tutorials
PREDICTIVE FILTERS (E.G. KALMAN) COMPARISON
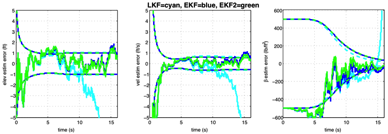
A classic textbook for predictive (tracking) filters is Applied Optimal Estimation, edited by Gelb (1974). In section 6.1 of that book are two simple radar tracking examples (6.1-2 and 6.1-3) which demonstrate several nonlinear filters. Both involve a body falling through the atmosphere while a ground radar measures its range, so nonlinearity enters through both the drag dynamics and the measurement geometry. The book uses them to compare the extended Kalman filter, the iterated extended Kalman filter, and a second-order filter, showing how each copes with linearization error. These examples are instructive as the differences are easy to see in simple plots. I've programmed up those examples into a Matlab script and added a few additional filters to compare and contrast them in both linear and nonlinear cases.
InvGN: GAUSS-NEWTON NONLINEAR INVERSION CODE
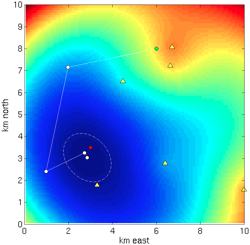
Calculate Tikhonov-regularized, Gauss-Newton nonlinear iterated inversion to solve the damped nonlinear least squares problem, using the InvGN toolkit for Matlab/Octave. While Matlab's optimization toolbox contains `lsqnonlin`, it does not inherently include the Tikhonov regularization and is only the optimization component, whereas inversion also requires uncertainty quantification. My InvGN package is for weakly nonlinear, Tikhonov-regularized, inverse problems (so includes solution uncertainties and resolution quantification), handles both frequentist and Bayesian frameworks, and also works in Octave.
INTRODUCTORY BEAMFORMING TUTORIAL
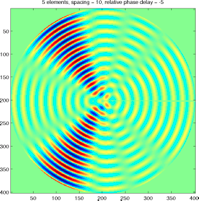
Using beamforming you can direct the majority of signal energy you transmit from a group of transducers (like audio speakers or radio antennae) in a chosen angular direction. Or you can calibrate your group of transducers when receiving signals such that you predominantly receive from a chosen angular direction. By introducing carefully chosen delays (phase shifts) at each transducer, the individual waves add constructively in the desired direction and cancel out elsewhere. The same principle underlies technologies from 5G and Wi-Fi networks to sonar, radar, medical ultrasound imaging, and directional microphones, allowing the beam to be steered electronically without physically moving anything. Here's a simple, introductory tutorial demonstrating the phenomenon using Matlab scripts to superimpose waves emanating from an array of sources.
PLANETARY TIDES
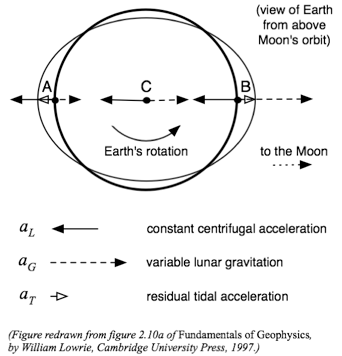
Let's calculate tidal accelerations on Earth due to other solar system planets, and then on Europa due to Jupiter for comparison. Following the material in section 2.3.3 of Lowrie's )_Fundamentals of Geophysics_, we can calculate the tidal accelerations on the Earth due to various other bodies in the solar system and compare them in a Matlab script for the purpose. How strong are the pulls of other planets compared to that of the Sun or Moon? Will the other planets have any noticeable effect on Earth's tides? Then we can also calculate the tidal acceleration on Europa due to Jupiter and compare that to the Earth ones to get a feel for the stresses seen in Europa's cracking ice.
INVERSE THEORY RESOURCES
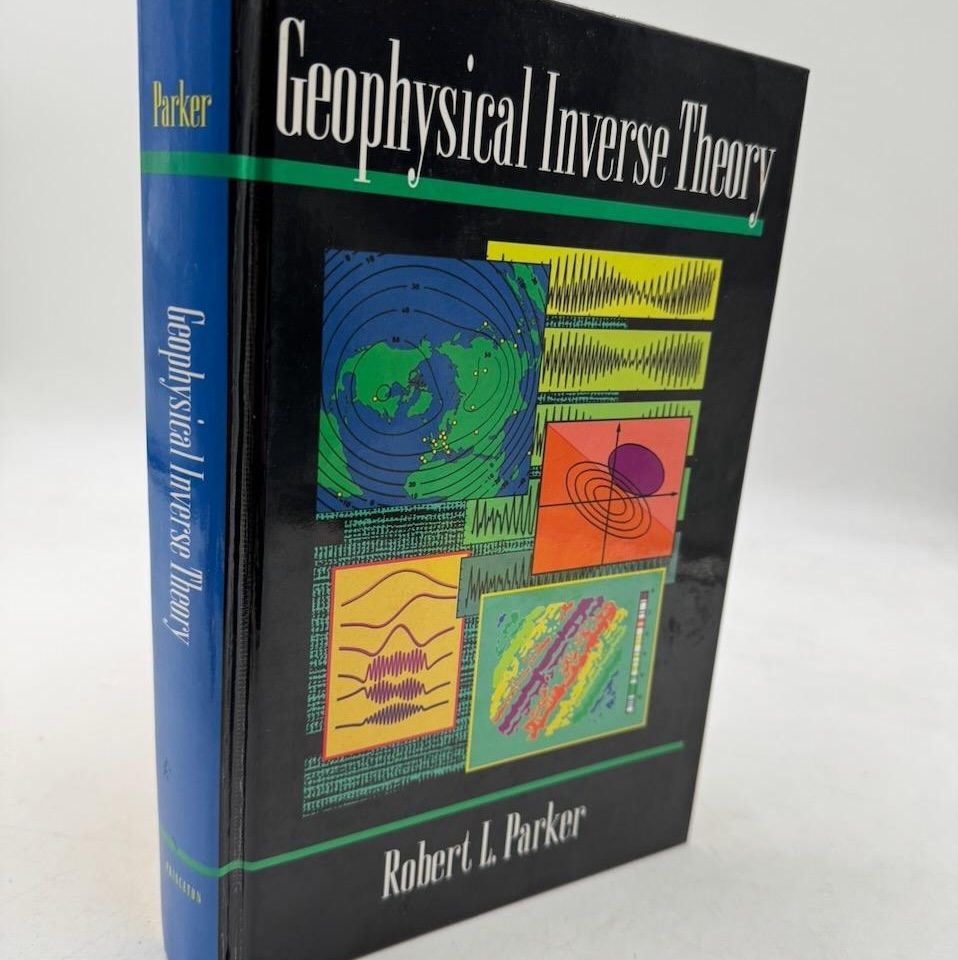
This page was the old inverse theory resources page on my old website, and it still has a lot of useful material (albeit some broken links). It contains lecture notes, intro material, textbooks and helpful papers, and related web links, all on aspects of geophysical inverse theory. The lecture notes are from my Inverse Theory Computational Lab class at the University of Washington (Seattle), ESS523, taught by professor Ken Creager. The textbooks and papers are those I'd found most useful in my own research and teaching on inverse theory.
SEATTLE FAULT GRAVIMETRY

This was a neat grad-school class project to learn about the non-uniqueness in solutions to this problem. Gravity data were measured across the Seattle fault zone, on the east and west sides of Lake Sammamish, near Seattle, WA. Large gradients are seen in the data, about 50 mgal on the west side of the lake (“Bellevue” data) and about 30 mgal on the east side of the lake (“Issaquah” data). The data are compared to a mathematical horizontal slab model for a vertical fault, and while fault modeling of gravity data offers no unique solution, the measured data and its differing gradients between the two tracks are roughly consistent with a model that uses the change in depth of the Seattle basin seen in other data sources.
EUROPAN DOUBLE RIDGES
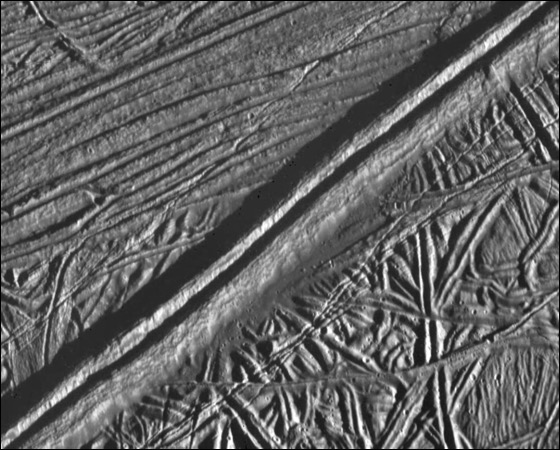
When I was a graduate student in the University of Washington's Applied Physics Laboratory, in a core class on continuum mechanics we were asked to propose a research project. I proposed to develop a numerical model to investigate the linear diapir hypothesis for the formation of ice double ridges on Europa, one of Jupiter's moons. The model was developed and compared to estimated 3D data of Europan ridges from photoclinometry. The results offered quantitative evidence to support or reject the linear diapir hypothesis, and provided constraints on the thickness of the ice layers covering the suspected ocean on Europa.
HELIOSEISMOLOGY
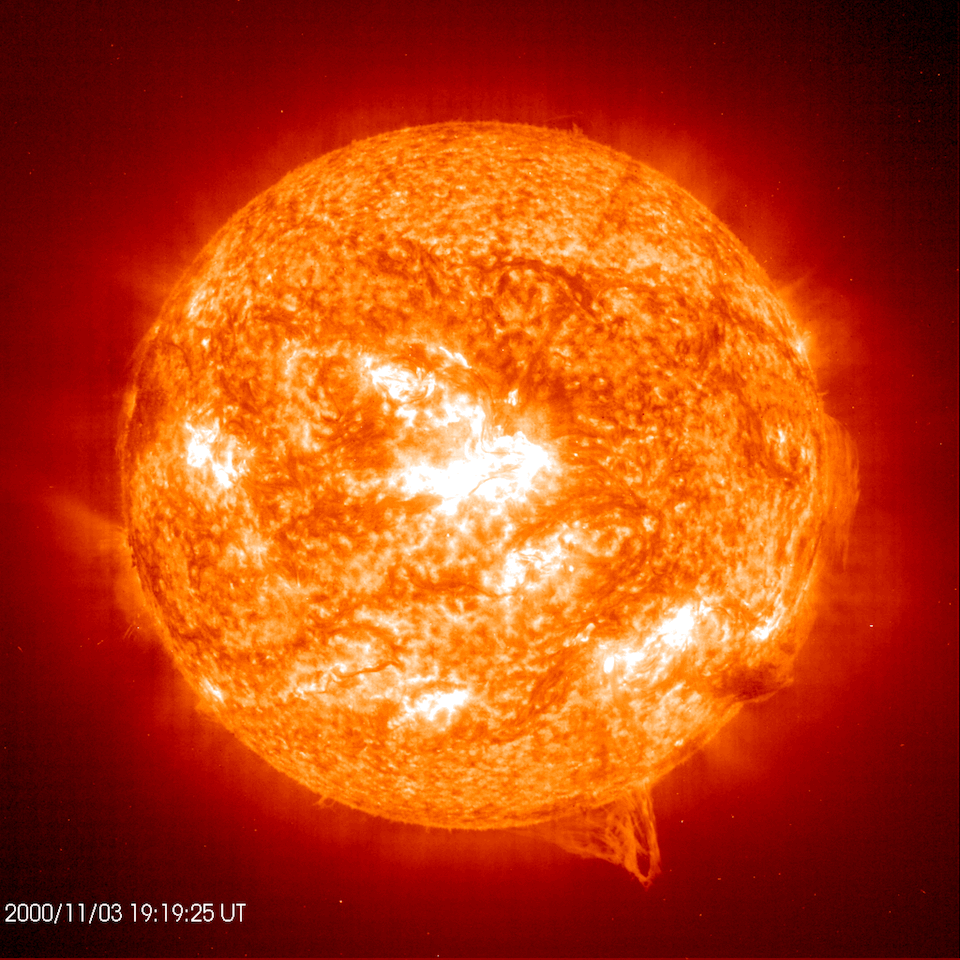
When I was a graduate student in the University of Washington's Earth and Space Sciences department, in a space plasma physics core class we were asked to propose a research project. I proposed to develop a web-based Java applet to demonstrate raytracing of ion-acoustic waves through the Sun's interior, and to use it to illustrate the effects of different sound-speed profiles on the raypaths. The applet was developed and made available on the Internet, and this page describes the theory behind it, its operation, and some of the results that can be obtained with it.
RAYTRACING JAVA APPLETS
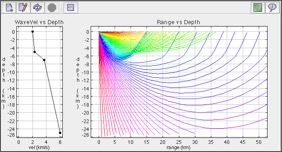
Raytracing is a high-frequency approximation to the propagation of waves in a medium, and it makes pretty cool animated plots. We specify a set of rays, normal to the wavefronts, and we can set properties of the environment like dimensions and wavespeeds, and then we can watch where the wave energy goes by watching where the rays go. If the wave velocity is a non-constant function of location in the medium then these then rays will curve, sometimes overlapping each other, sometimes leaving wide gaps in where they return to the surface. This raytracing approach can be used for seismic waves in the Earth, for acoustic waves in the ocean (an "ocean" option will be available before too long on this applet), and even for ion-acoustic waves traveling through the Sun - I've both Cartesian and Polar versions of this Java applet on here to play with (click respective graphic to go to either).
OFFICE ASTRONOMY
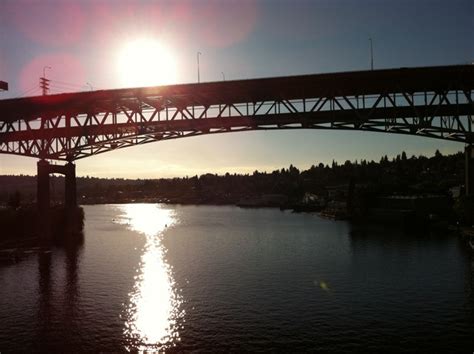
Often when late afternoon rolled around in my old APL-UW office, the standard mental slump set in, signaling it was time for the trip up to the local coffee shop with a colleague. Usually I'd realize I've been staring mindlessly at the wall and the shadows on it, and that meant it was time to go. I noticed that those shadows on my office wall flashed for a short time at the end of the day, because they're from the pre-sunset sun shining between the cars on the I-5 bridge. It was pretty cool actually - the edges of these shadows were remarkably focused and you can clearly see the outlines of the cars and trucks as they whiz by through the rectangle of light on my wall, making the room flash between light and dark. This event only happened for a short window of time, and at a slightly different time each day, so I started recording those times.
No matching items