(This was a neat grad-school class project about raytracing of heliospheric ion-acoustic waves, UW Geophys 515, Winter 2003)
A WEB-BASED JAVA APPLET FOR THE VISUALIZATION OF HELIOSEISMOLOGICAL RAYTRACING*
Andy Ganse, ESS 515, 14 Mar 2003
Helioseismology is the study of the surface oscillations on the Sun to infer its interior structure. The process is analogous to seismology on Earth, with which we use seismograms measured at the Earth's surface to deduce the Earth's interior structure. While the term "helioseismology" refers specifically to our Sun, the same idea applies to all stars, yielding the broader term "astroseismology" (although because of their distance, and hence very limited luminosity and angular width, analysis of solar-like stars besides our Sun have not been successful as yet -- on the other hand, there have been successful astroseismic analyses of non-solar-like stars such as Cepheid variables and white dwarves).1 The Sun's surface oscillations are measured via Doppler spectroscopy and subtle luminosity changes, and are observed both from networks of observatories on the surface of the Earth as well as from space. These Doppler and luminosity measurements yield frequency information about ion acoustic sound waves traveling through the interior of the Sun. Both wavemode and ray-based approaches have been useful for analyzing the wave measurements over the decades, with increasingly fascinating results, but the concepts behind these methods can be difficult to grasp for the students just learning them. With this in mind, a web-based, graphical Java applet which demonstrates helioseismological raytracing has been created and made available on the Internet.2 This paper discusses the design and operation of this applet and the theoretical concepts associated with it.
HISTORY AND BACKGROUND
Although the simple oscillation of pulsating stars was discovered back in the late 1700s, it wasn't until 1960 that Robert Leighton observed radial oscillations of our Sun with periods on the order of five minutes. During much of the 1960s it was thought that these oscillations were responses to convection near the surface of the Sun, but by the end of the decade Edward Frazier showed the oscillations weren't theoretically consistent with convection.3 Ulrich, and independently Leibacher and Stein, then predicted that the oscillations were due to resonant acoustic wave modes in the Sun, and in 1975 Deubner observed the wavenumber and frequency patterns in the oscillations that confirmed this prediction.3 In the time since, helioseismological measurements and analyses have provided for ongoing updates to the standard model for solar structure predicted by theoretical physics, via not only a sound speed profile over the radius of the star, but also a profile of internal rotation. In 1985 the first full inversion of the Sun's average radial sound speed profile actually led to corrections in the theory of the opacity of matter, which much improved the standard solar model and helped other areas in astrophysics as well.3 The 1990s saw the creation of several new ground-based networks of observatories specifically designed for continuous solar observations (for example the Global Oscillation Network Group, or GONG5). And in 1995 the SOHO spacecraft was launched and has since brought unprecedented measurements of solar phenomena as it orbits around the L1 Lagrangian point between the Sun and the Earth6. All is not finished however; there is still a discrepancy between the fit of a solar model to the helioseismological measurements and the fit of the model to the measured flux of neutrinos emanating from the solar core. These neutrinos can be measured from the Earth, and the solar model with the closest possible match to the helioseismological measurements predicts a much greater neutrino flux than has been measured. This discrepancy is at least now better than in earlier solar models, but is still not resolved3,4. Also, while recent measurements from SOHO have provided enough information to resolve various scales of individual convection cells6,7 and even solar flares on the far side of the sun8, there is still a limit to the accuracy of the measurements of oscillations, which in turn makes for limits to the inversion of the Sun's interior structure. In particular the Sun's core has not been resolved and some of its state still remains a mystery3.
Measurement of the Sun's (or another star's) surface oscillations allow for the deduction of a number of its internal features. These oscillations are the surface manifestations of sound waves that travel through the interior of the star and act as a probe to the properties inside. The oscillations are generally measured by either recording the subtle variations in luminosity of the Sun, or by recording the slight fluctuating Doppler shift of the Sun's absorption lines using a spectrometer. Either can be done over the whole disc of the Sun at once, or on a small subregion of the disc. In both cases, however, the fluctuations are very slight since the amplitude of oscillation modes are only on the order of 0.1m/s3, and the period of oscillation is very slow -- on the order of five minutes to an hour -- so sophisticated methods must be used to make these measurements.
THEORY OF SOUND WAVE PROPAGATION IN THE SUN
While a number of different types of waves propagate through the Sun, the main ones of interest to helioseismologists are ion acoustic waves. These are sound waves, analogous to the sound waves that travel through rock or water on the Earth. However, the plasma in the Sun is not necessarily a collisional medium, that is, unlike the sound waves in rock or water the ion acoustic wave energy in plasma does not travel by collisions between ions. Instead, the electromagnetic fields of these charged particles interact with each other to pass on the wave energy, even though the particles themselves may be too far apart to actually collide with each other. In any case, by analyzing the frequency content and spatial distribution of the solar surface oscillations caused by these sound waves, a wealth of information can be resolved about the star's interior, including profiles of sound speed, temperature, and density, elemental and isotopic abundances, interior mixing, and interior rotation and flows3.
Overall, the speed of sound in the Sun generally increases toward its center, and just below the visible solar surface the sound speed drops off dramatically due to a sudden density decrease4. The result is that a downward-traveling acoustic wave is refracted back up toward the surface and that an upward-traveling acoustic wave is essentially reflected off the surface, trapping the wave in an acoustic cavity. Constructive interference of a wave trapped in an acoustic cavity creates a resonance at a certain frequency that is characteristic of the cavity. Various acoustic waves in the Sun have different frequencies and thus different cavities, spanning a multitude of depths in the Sun. From the resonant frequency of a given cavity one can deduce the average sound speed in that cavity, and by measuring a number of these resonant frequencies via the oscillations on the surface of the Sun, one can form a whole sound speed profile for the Sun via the process of inversion3,9.
An efficient way to calculate the propagation paths of these acoustic waves is by the method of raytracing. A sound wavefront is approximated as following an arced path (a "ray") from one point on the surface, down into the Sun's interior, and back up to another point on the surface. From the travel time and horizontal distance measurements for a given ray from a point source, one can deduce velocity information about the Sun's interior9.
The sound speeds within the Sun are calculated from the Sun's temperature profile in the standard solar model, estimated from knowledge of stellar physics and measurements of the Sun's surface. Given these temperatures, one may calculate the sound speeds via the relation in Equation 1 below10,11. This sound speed is the phase velocity of ion acoustic waves.
In Equation 1, cs is the ion acoustic wave speed, gamma is the polytropic index, Ti and Te are the ion and electron plasma temperatures, and mi is the ion mass. The value of gamma ( = (2+N)/N ) for the compressions of ion gas is chosen here to be 3, because the assumption of a small collision frequency in the plasma narrows the case to one-dimensional, leaving only one degree of freedom (N=1). In a typical case![]() and this temperature is taken from the standard solar model. As the majority of the Sun's interior consists of hydrogen, the ions are taken to be hydrogen ions, so the proton mass is used for mi.
and this temperature is taken from the standard solar model. As the majority of the Sun's interior consists of hydrogen, the ions are taken to be hydrogen ions, so the proton mass is used for mi.
The method of raytracing is an approximation, but an acceptable one as long as the wavelength of the wave is much smaller than features in the sound velocity profile, or in other words, the wavenumber k << 1. Raytracing simply consists of the repetitious use of Snell's Law, which for a spherically symmetric geometry is given by the radial form9 seen in Equation 2.![]()
Overall, the Sun's internal velocity increases with depth, causing sound rays to be refracted back up to the surface. At the surface they experience a steep drop in the star's density and are reflected back into the interior, as seen in the screenshots of the Java applet later in the next section.
OPERATION OF THE JAVA APPLET
The helioseismology raytrace demonstration applet is accessed here; that page gives a brief introduction to the applet and options for starting the applet in different sizes. Note that to run this applet one may need to upgrade the Java plug-in of one's web browser by following the directions and link on the webpage; the installation process is quick and simple.
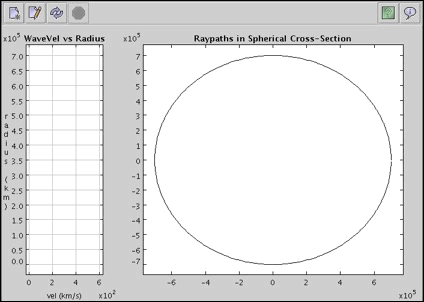
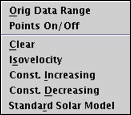
The initial screen looks like that seen in Figure 1 below. Note the toolbar buttons along the top; the function of each button appears in a label when one pauses the mouse pointer over the button. Right-clicking either of the two main plot areas calls up the pop-up menus seen in Figures 2a and 2b. The help button at the top right, with the green question mark on it, calls up a brief help screen to remind the user what basic steps to follow to operate the applet. These basic steps are also mentioned on the introductory webpage.
Figure 1. The initial applet screen.

![]()
Figure 2. a.) At left, pop-up menu for left plot area, and b.) at right, pop-up menu for right plot area.
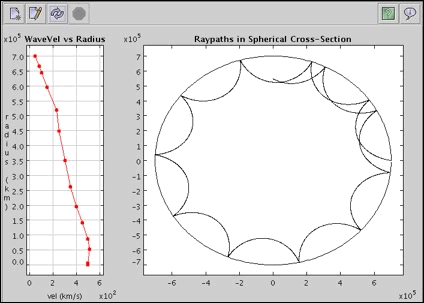
A basic session consists of the following. Once the applet has finished loading to its initial state as in Figure 1, right-click the mouse pointer in the background of the left-hand plot (the wave velocity plot). From the pop-up menu, choose one of the present velocity profiles from the menu, for example the "standard solar model". Note, incidentally, that in this particular profile one can see the regions of the core, the radiative zone, and the convective zone of the Sun in the changes in the velocity data. Next click the Run button in the toolbar (the button with the swirling arrows), and wait a few moments for the raypaths to appear in the polar plot on the right. The result will look something like Figure 3 below. In either plot the user may click and drag the mouse to zoom in and out around the data, and choose "Orig Data Range" in the pop-up menu to undo the effects of the zooming. Also in either plot the user may toggle the presence of data points on the plotlines via the "Points On/Off" entry in the pop-up menu.
Figure 3. A completed run, this one for the "standard solar model" preset velocity profile.
The ray began at q = 0˚, r = 7x10⁵ km, ie halfway up the right side of the plot, and ended at the top after traveling 1.25 times around the circumference.
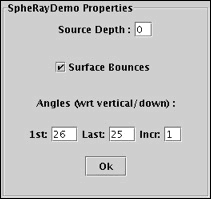
Finally, the user may use the "Edit Run Properties" button in the toolbar to call up the Properties dialog and tailor a calculation further. The Properties dialog is shown in Figure 4 below. With this dialog the user may change the source depth so that the source is somewhere other than the surface of the Sun, turn off the surface bounces to only calculate a single ray arc, and set the take-off angles of rays from the source location. The default is to calculate only a single ray, as seen in the values in Figure 4. But the user may specify multiple rays by setting values of, say, 1st: 26, Last: 15, Incr: 1. This example specifies 10 rays, with take-off angles relative to vertical-downward (toward the center of the Sun) of 26, 25, 24, etc. degrees. Note that calculation time multiplies with each additional ray, so it is not recommended to specify more than 10 or so rays at a time.
Figure 4. The run properties dialog.
REFERENCES
1. Christensen-Dalsgaard, Jørgen, Lecture Notes on Stellar Oscillations, Institut for Fysik og Astronomi, Aarhus Universitet, 4th ed., Feb 1998.
2. Ganse, Andy, "A Java Helioseismological Raytrace Demonstration Applet", http://staff.washington.edu/aganse/helioseis/intro.html
3. Harvey, John, "Helioseismology", Physics Today, Vol. 48, No. 10, Oct. 1995.
4. Leibacher, John W., Robert W. Noyes, Juri Toomre, and Roger K. Ulrich, "Helioseismology", Scientific American, Vol. 253, No. 3, Sept. 1985.
5. Global Oscillation Network Group (GONG), organization website http://www.gong.noao.edu.
6. Fleck, B., P. Brekke, S. Haugan, L. Sanchez Duarte, V. Domingo, J.B. Gurman, and A.I. Poland, "Four Years of SOHO Discoveries -- Some Highlights", ESA Bulletin 102, May 2000.
7. Gizon, L., T.L. Duvall Jr., and J. Schou, "Wave-like properties of solar supergranulation", Nature, Vol. 421, Jan. 2003, p.43.
8. Lindsey, C., and D.C. Braun, "Seismic Images of the Far Side of the Sun", Science, Vol. 287, 10 March 2000, p.1799.
9. Shearer, Peter M., Introduction to Seismology, Cambridge University Press, New York, 1999.
10. Parks, George K., Physics of Space Plasmas: An Introduction, Westview Press, Boulder, 1991.
11. Winglee, Robert, "Introduction to Space Plasma Physics", class notes from Earth and Space Sciences 515, winter quarter 2003, University of Washington.
