
Note that this raytrace applet is in rectangular coordinates, while the one in the Helioseismology section is in polar coordinates. Someday it'd be nice to combine them into one applet and allow to choose between solar vs solid-earth vs ocean-acoustic scenarios, and rectangular vs spherical geometry ...someday!
Raytracing is a high-frequency approximation to the propagation of waves in a medium, and it makes pretty cool animated plots. We specify a set of rays, normal to the wavefronts, and we can set properties of the environment like dimensions and wavespeeds, and then we can watch where the wave energy goes by watching where the rays go. If the wave velocity is a non-constant function of location in the medium then these then rays will curve, sometimes overlapping each other, sometimes leaving wide gaps in where they return to the surface. These behaviors affect how well we can try to resolve a velocity profile by only analyzing signals we receive at the surface. This raytracing approach can be used for seismic waves in the Earth, for acoustic waves in the ocean (an "ocean" option will be available before too long on this applet), and even for ion-acoustic waves traveling through the Sun.
The interactive Java applet below allows you to play with raytracing in rectangular coordinates, appropriate for local/smaller-scale problems or for larger-scale problems that have been mapped through the "Earth-flattening" transformation (warping the vertical axis to account for the curvature of the Earth or whatever body). If you have Java install and enabled in your browser (if not, see here), click one of the versions below to start the applet - it may take a few moments to initiate.
Compact Version: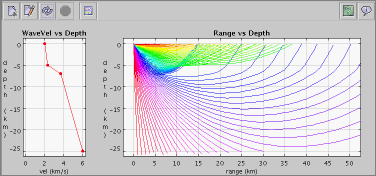
Click a screen size to begin the applet:
Sm (750x350), Med (950x400), Lrg (1200x500)
Or the version with the T/X plot: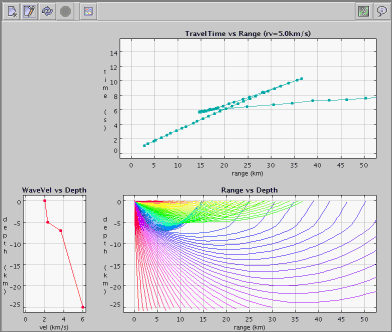
Click a screen size to begin the applet:
Sm (750x660), Med (950x760), Lrg (1200x960)
To run the applet: click the link for the size appropriate for your screen size. The green question-mark on the top right offers a brief help listing, but the most immediate way to start is to :
• right-click the WaveVel-vs-Depth plot on the left
• pick a premade velocity profile off the menu
• click the swirling-arrows ("run") button at the top to create the rays in the plot on the right.
• after the rays appear click the "extra plots" button in the middle of the toolbar to see plots between travel time, P, and range.
• once you get the hang of it be sure to try clicking in some of your own velocity profiles!
This applet be run as an applet on a webpage like above, but also as a standalone application by starting it at the command-line with the command java -jar raydemo.jar. That jarfile, and the whole source for this thing, can be found at my GitHub page for RayDemo.
If you have problems getting this applet to run in your browser, please be sure you have the Java plug-in installed and working, which you can test by seeing if you can run one of Sun's Java example applets A, or Java example applets B. (These two pages look the same but have slightly different code for different browser types.) If you can't run those then your problem is with Java and you'll need to go figure that out separately...